

Accounting dashboard
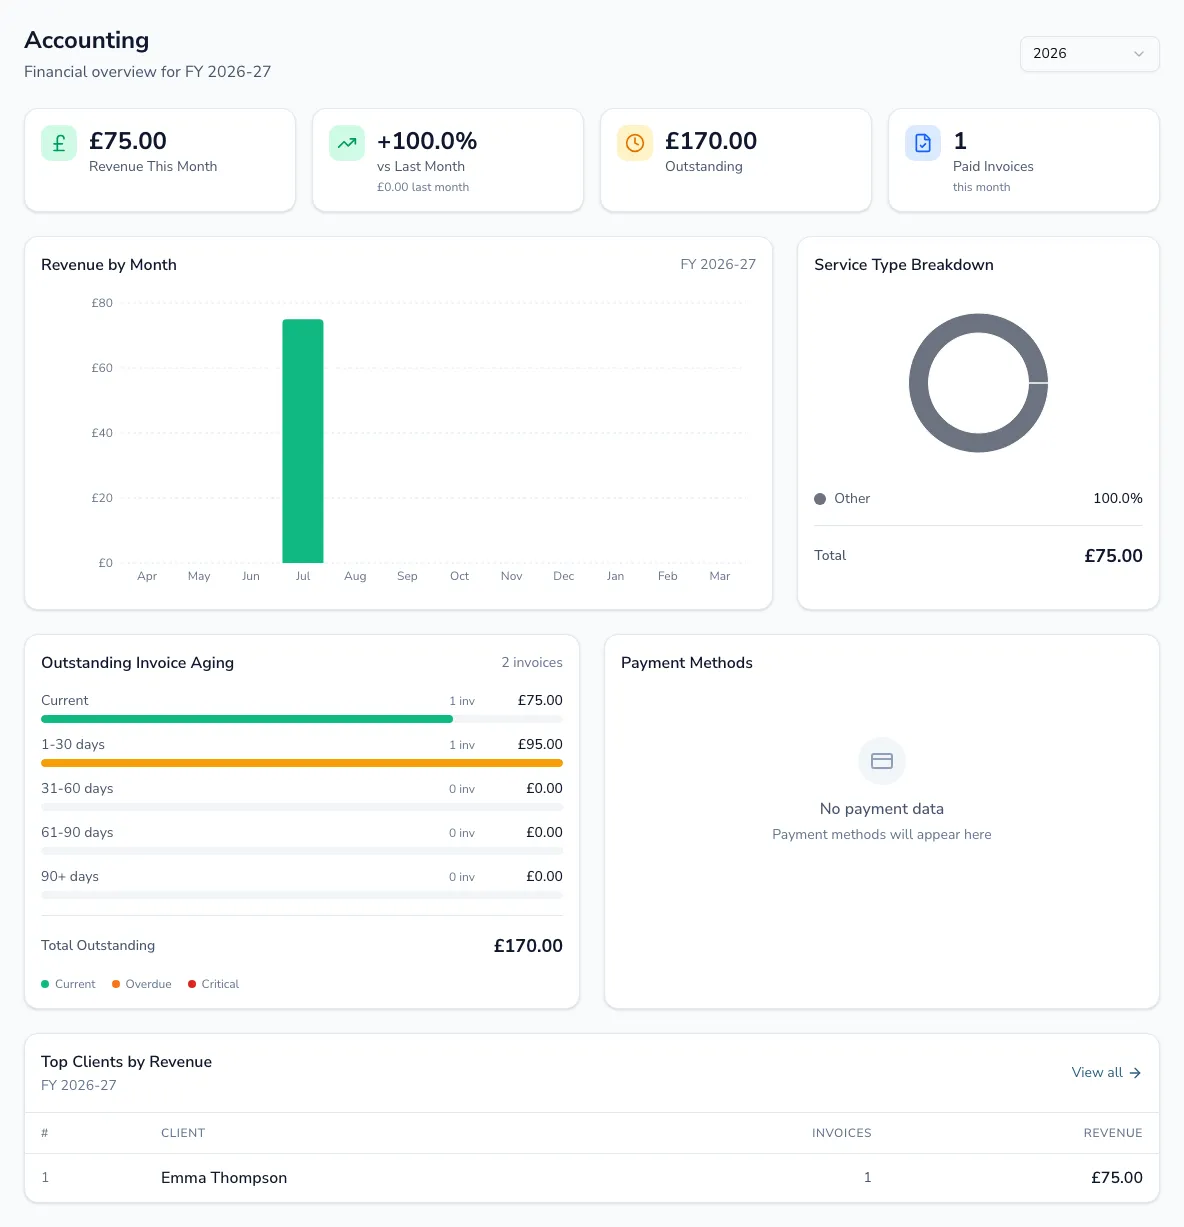
One page answers “how’s the practice doing financially?” — this month’s revenue and how it compares, what’s outstanding and how overdue it is, where the money comes from, and who’s bringing it in — all for a UK financial year you choose.
At a glance
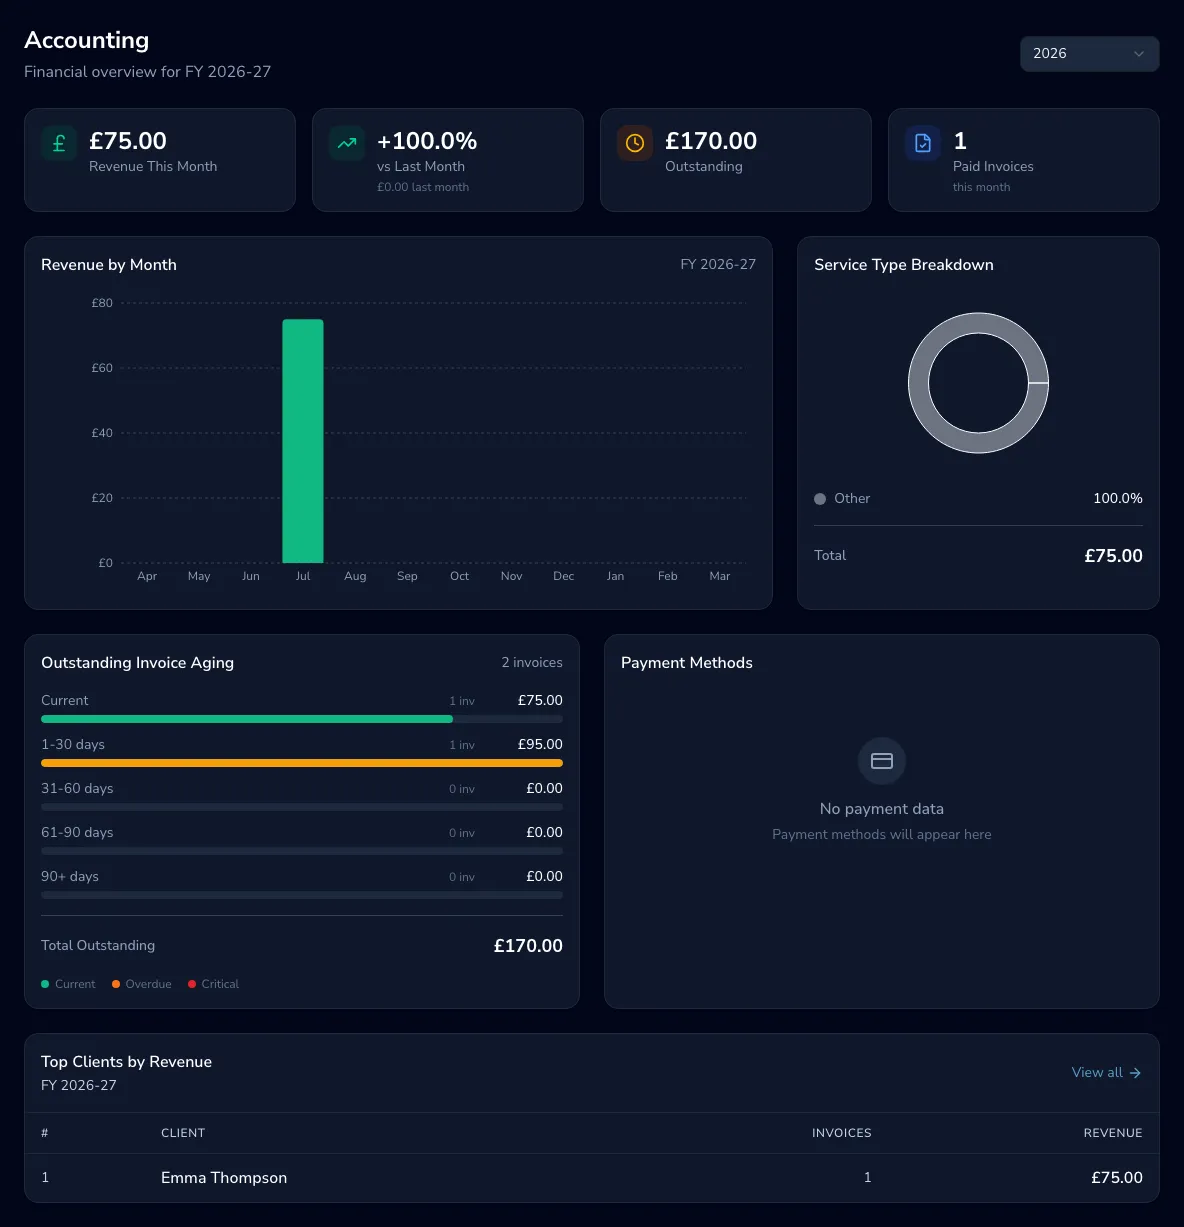
Section titled “At a glance”Four headline figures: revenue this month, how that compares to last month (with the amount either side), the total currently outstanding, and how many paid invoices you’ve had this month.
The charts
Section titled “The charts”- Revenue by month — a bar chart across the financial year; hover any bar for the exact figure and invoice count.
- Service-type breakdown — a pie chart of where your revenue comes from.
- Outstanding invoice ageing — unpaid invoices bucketed by how overdue they are (current, overdue, critical), with a total.
- Payment methods — the split between card, bank transfer, cash and so on, with amount and invoice count for each.
- Revenue by practitioner — for team practices only, once more than one practitioner has billed: each practitioner’s total revenue, appointment count and average per appointment, sorted highest first.
Top clients
Section titled “Top clients”A ranked table of your highest-value clients this financial year, with invoice count and total revenue. Choose a client to open their record, or View all to see every client.
Switching financial year
Section titled “Switching financial year”Use the year selector at the top to move between financial years and compare. Before you’ve invoiced anyone in the current year, the dashboard shows a prompt to create your first invoice instead of a page of empty charts; a past year with no activity is shown as simply having none, rather than nudging you to invoice retrospectively.